As is well knowm, FF competed very successfully in the 2nd
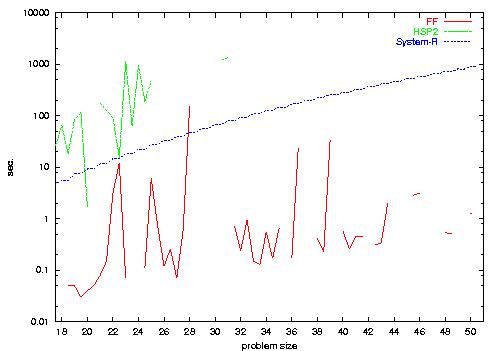
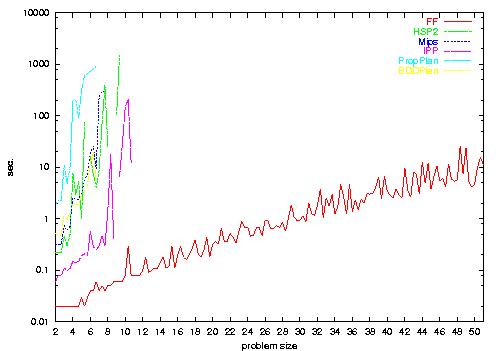
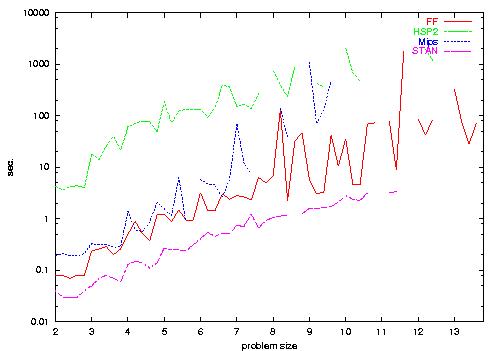
International Planning Competition. On this page, we show gnuplots of
the runtime data gathered in the fully automated track. The results
are widely known anyway, and serve here only as a means of comparison
to what
has happened in the 3rd International Planning Competition. The
plots generally do not include the data for all participants,
but only for the group of planners that scaled best (there was always
a group of planners that scaled significantly better than the
others). Time is shown on a logarithmic scale, and unsolved tasks are
left out of the plots.

1) Logistics runtime, shown on a logarithmic
scale.

2) Blocksworld runtime, shown on a
logarithmic scale.

3) Schedule runtime, shown on a
logarithmic scale.

4) Freecell runtime, shown on a
logarithmic scale.

5) Miconic-ADL runtime, shown on a logarithmic
scale. Note that this data is only for those three planners that
participated in the full ADL track of this domain.